

NAEP2022
 October 24 marked the release of National Assessment of Educational Progress test results for 2022. NAEP, popularly known as “The Nation’s Report Card,” assesses what the nation’s students in grades 4 and 8 know, and are able to do in reading and mathematics, and other subjects. This year, 224,000 students and 5,700 schools in Grade 4, and 222,000 students and 5,100 schools in Grade 8 participated in the “main NAEP.” You can learn more about NAEP through the resources linked in the right-hand column.
Private schools are included in NAEP’s sampling, and private school students’ scores are included in the national data. Unfortunately, an insufficient number of private schools agreed to participate in this year’s administration of NAEP to allow for a nationally representative sample, meaning that national results for private schools as a group could not be reported. Thankfully, the number of participating Catholic schools was of sufficient size to comprise a nationally representative sample, thus permitting their students’ performance to be reported as a national subgroup of private schools. The information appearing below shows how the nation’s Catholic school students fared in each of the subjects and at both of the grade levels assessed.
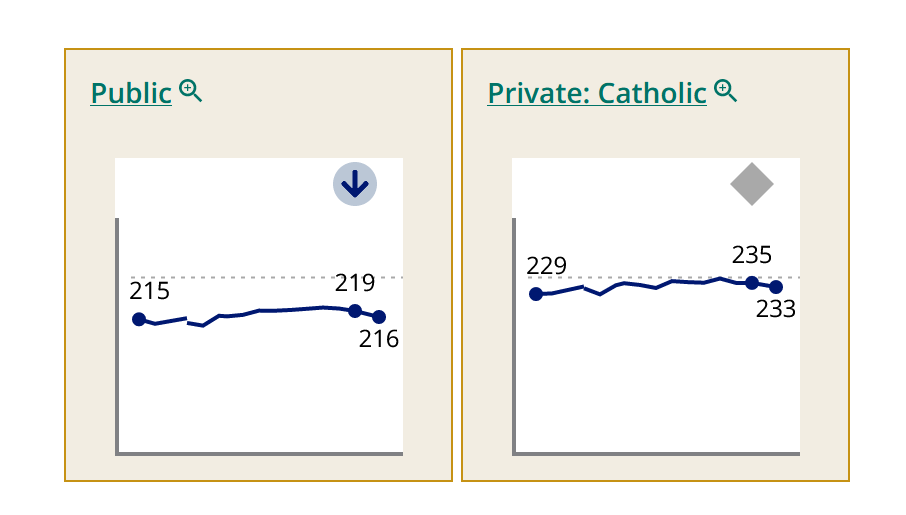
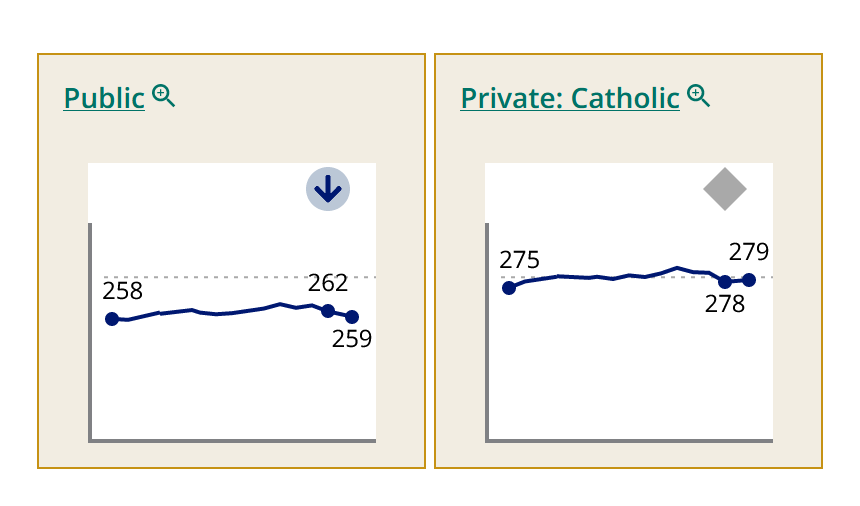
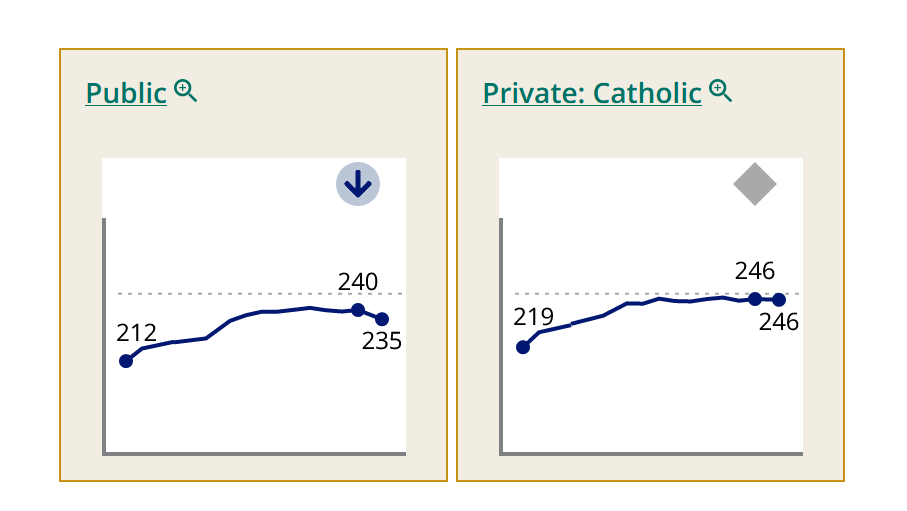
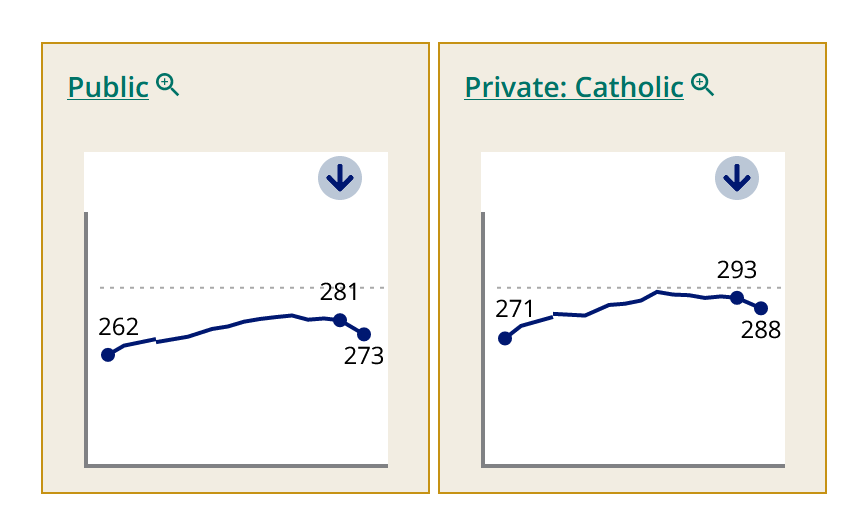
The following charts show line graphs comparing average NAEP scale scores in reading and math for national samples of 4th and 8th grade students attending public schools and Catholic schools. The graphs for math cover the period extending from 1990 to 2022, and those for reading extend from 1992-2022. The two dots at the right end of each line represent NAEP scores in 2019 (the most recent previous administration of the assessment) and 2022. The dark blue, downward-pointing arrows appearing within the light blue circles indicate that the average scale score obtained in 2022 was lower than the 2019 score by a statistically significant margin. The gray diamonds indicate no statistically significant difference between the average scale scores obtained in 2019 and 2022.
Learn…
- How NAEP differs from state assessments:
- What subjects NAEP assesses;
- How NAEP results are reported; and,
- How NAEP results are used.
Discover more about…
- Private Schools and NAEP
- NAEP Assessment Frameworks
- NAEP Achievement Levels
- The National Assessment Governing Board
- NAEP FAQs
Explore for yourself…
Reading: Grade 4
Reading: Grade-8
Math: Grade 4
Math: Grade 8
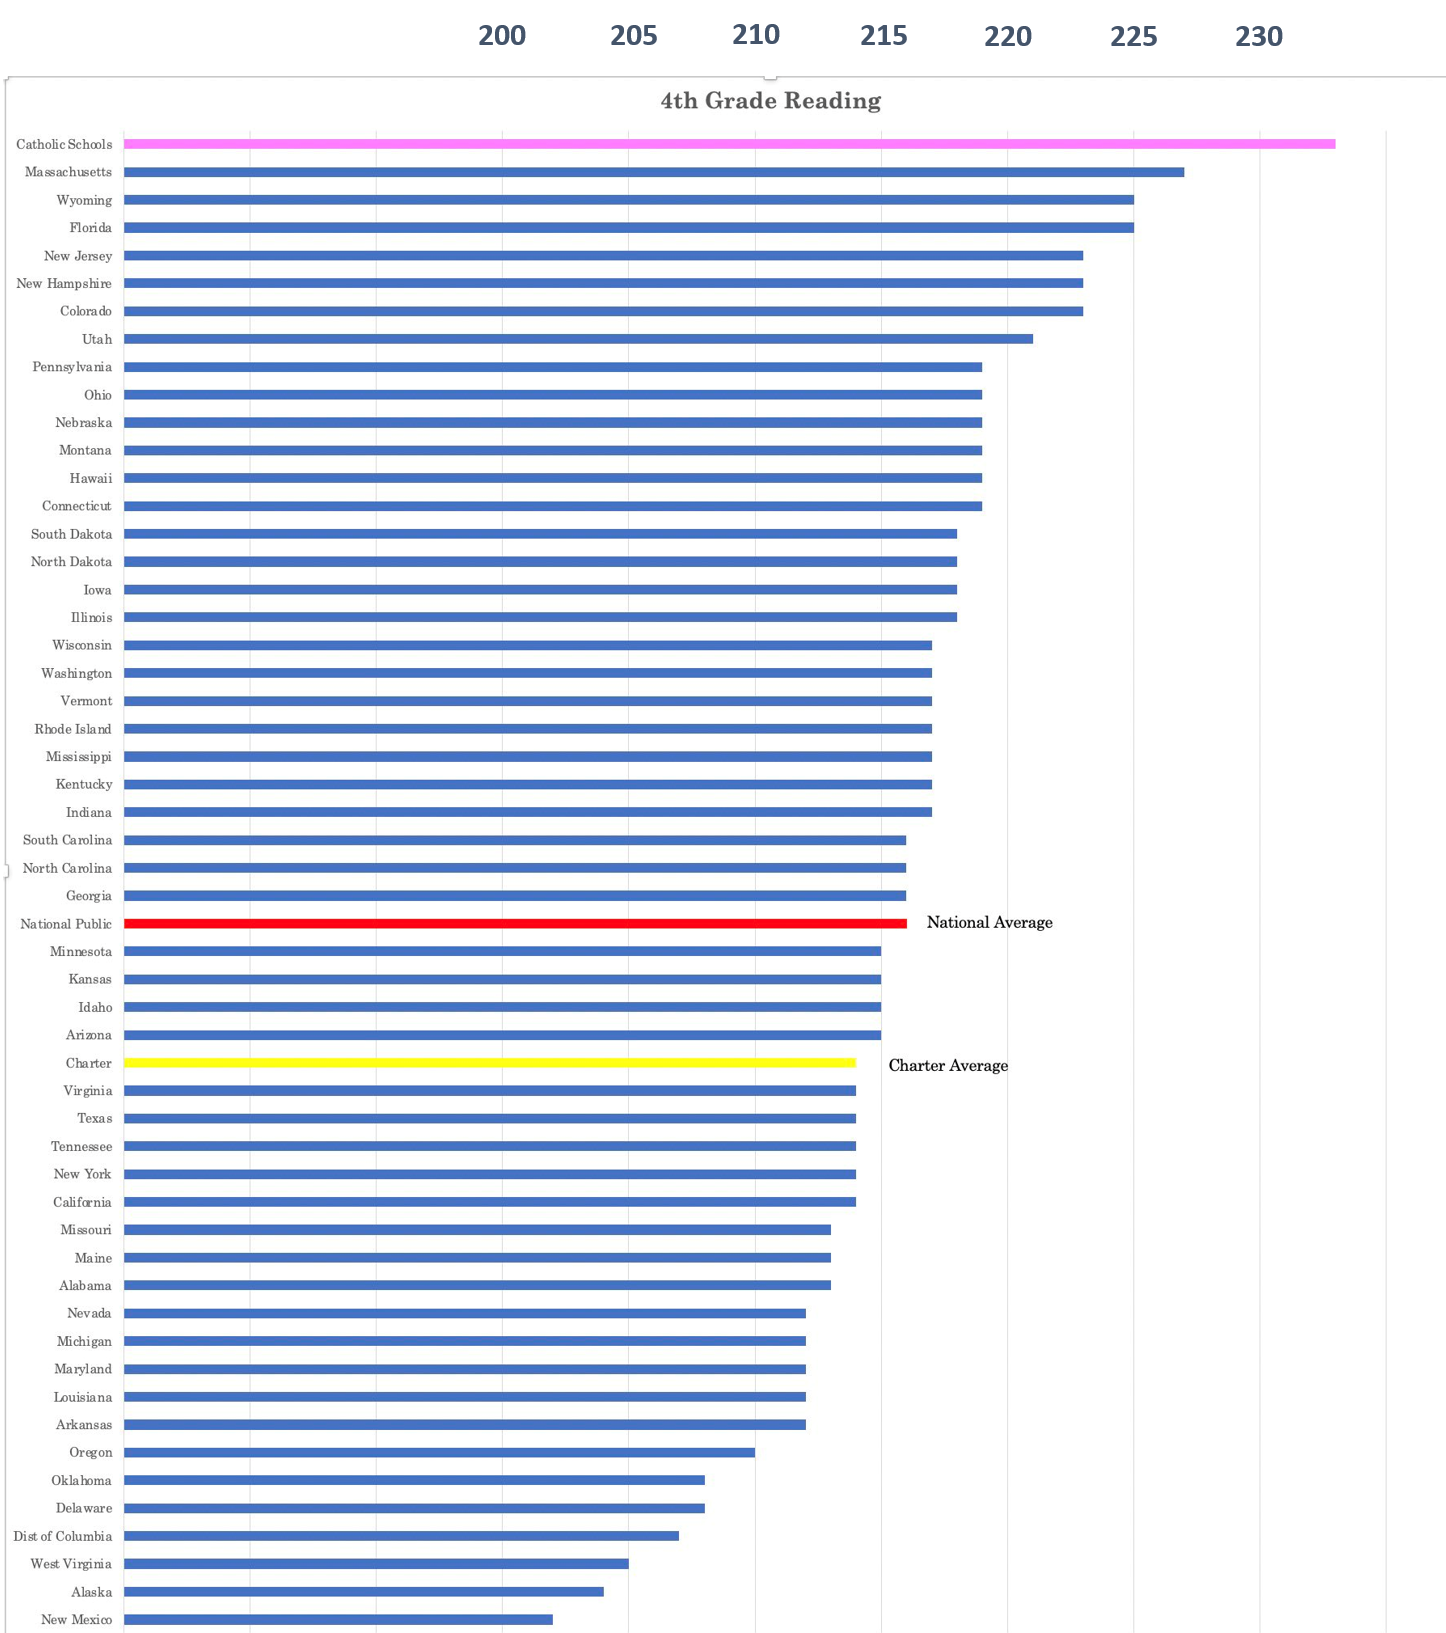
If NAEP treated its national sample of Catholic schools as a state, here’s how scores on each NAEP assessment could be reported:
In the graphs appearing below, the horizontal lines show the average NAEP scale scores for each state, and also show the average scores obtained by a nationally representative sample of Catholic school students.
——— Pink lines show Catholic school students’ scores
——— Red lines show the national average scores
——— Yellow lines show charter school students’ scores
Reading: Grade 4
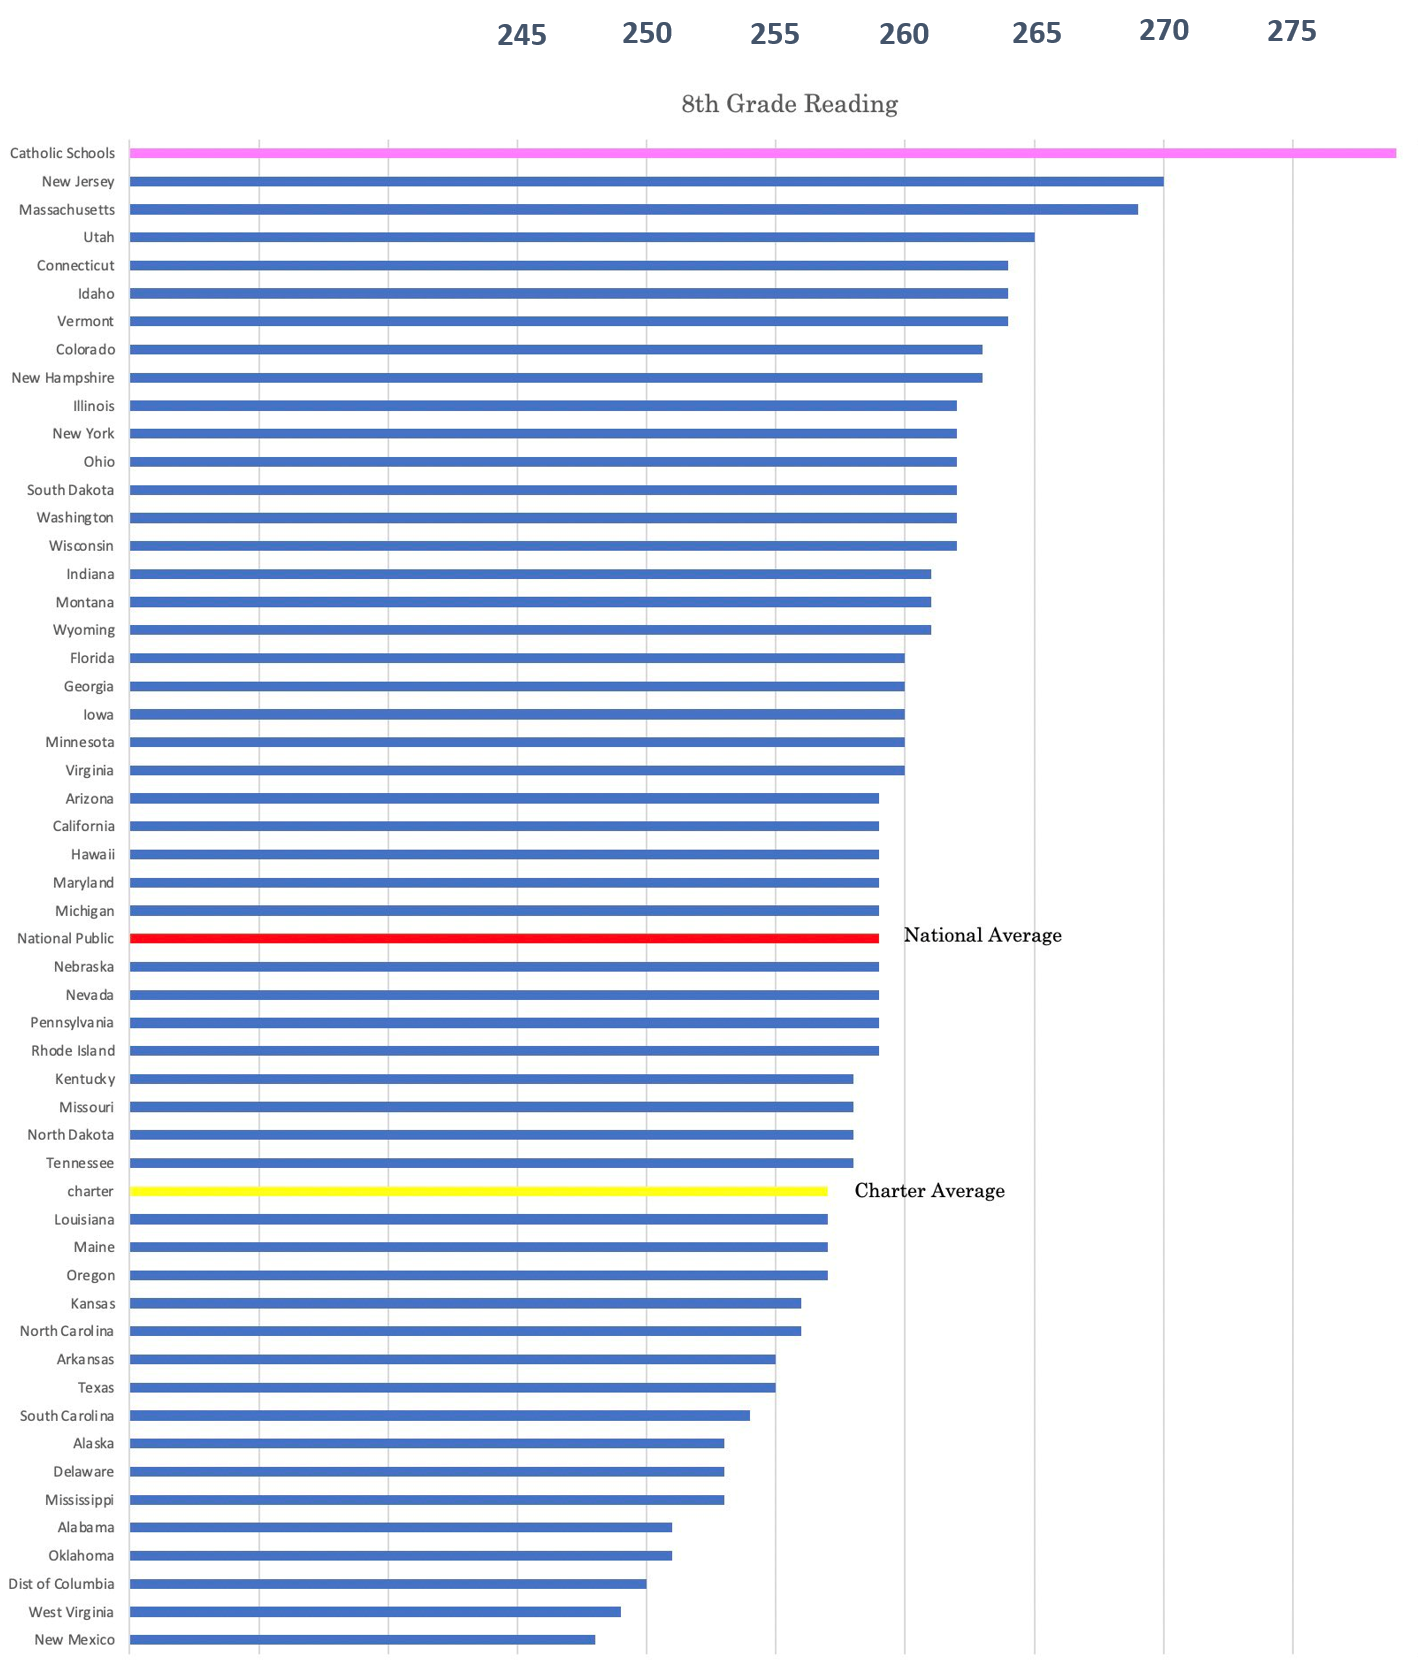
Reading: Grade 8
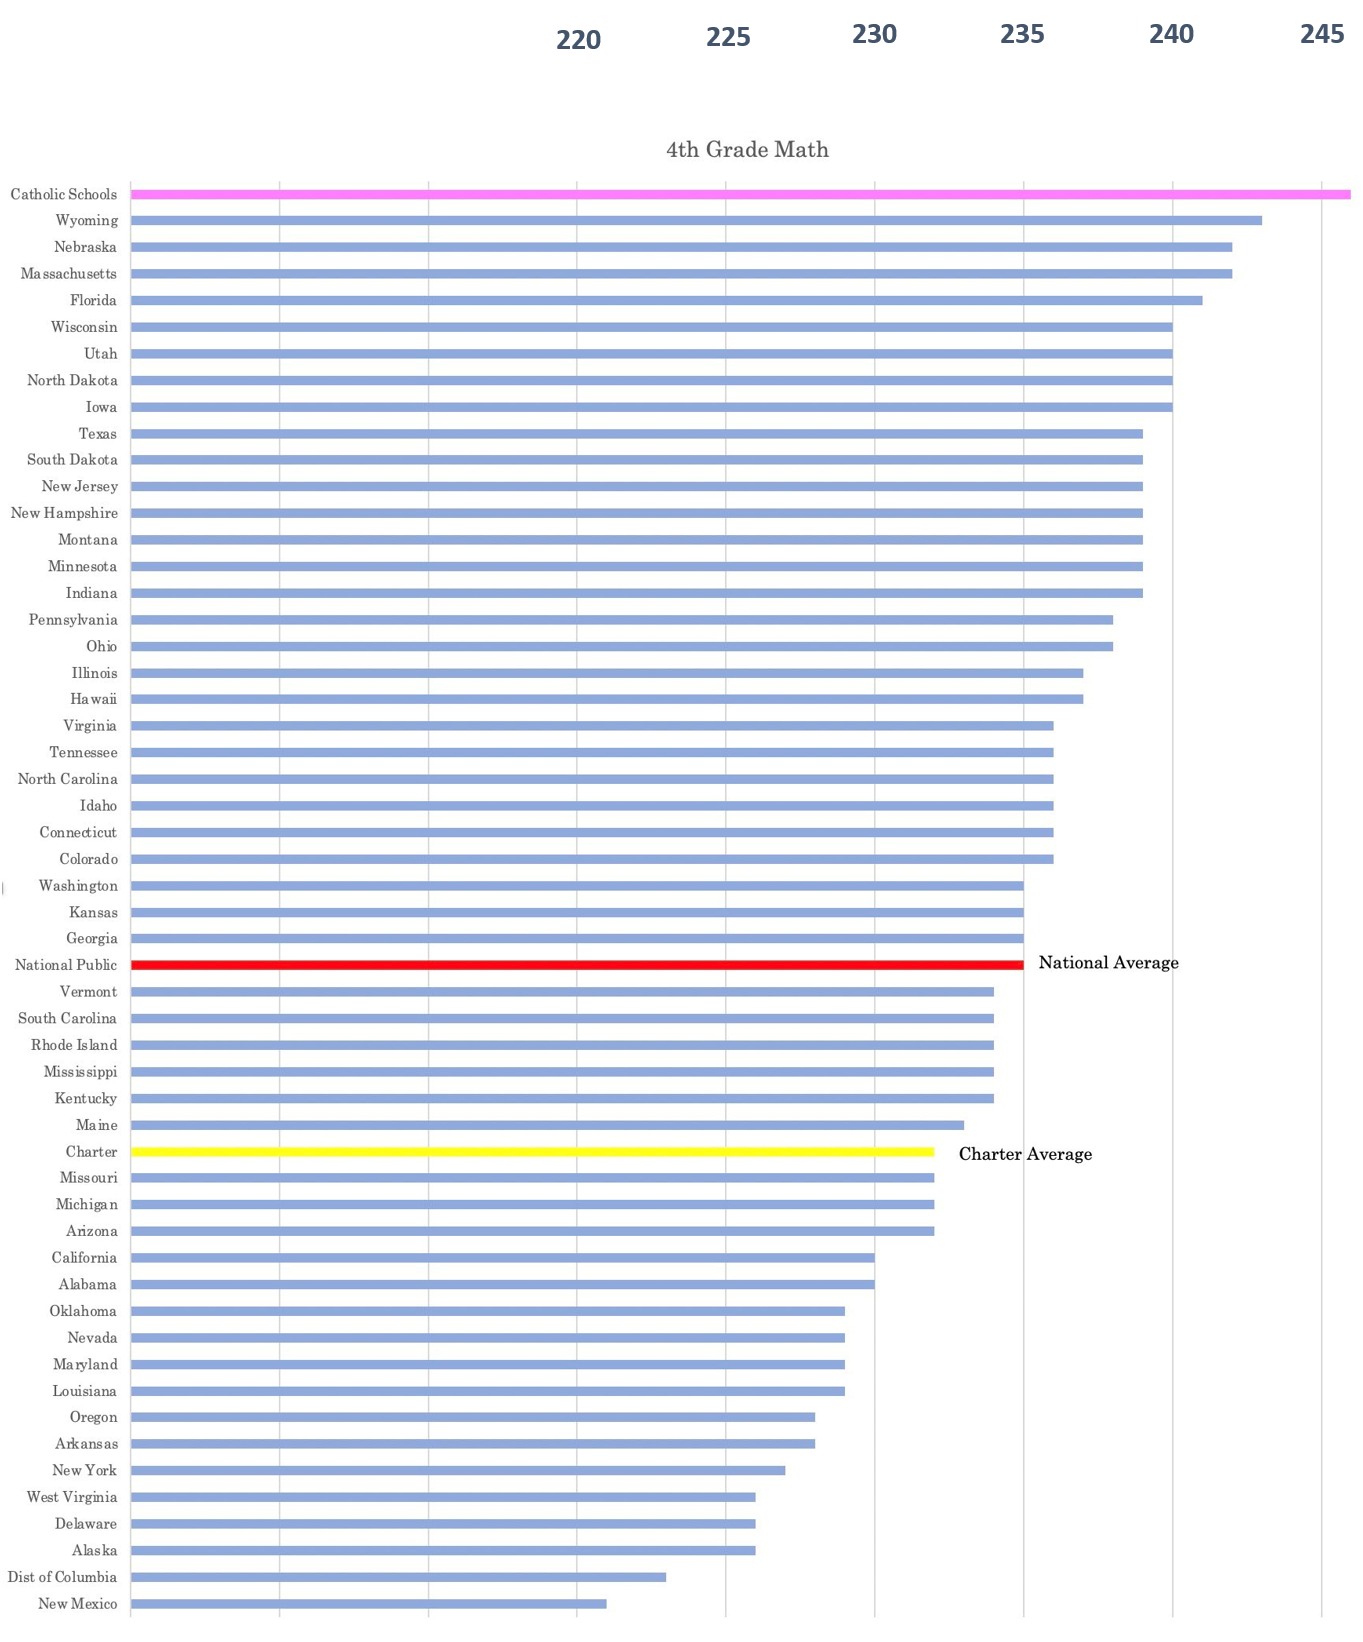
Math: Grade 4
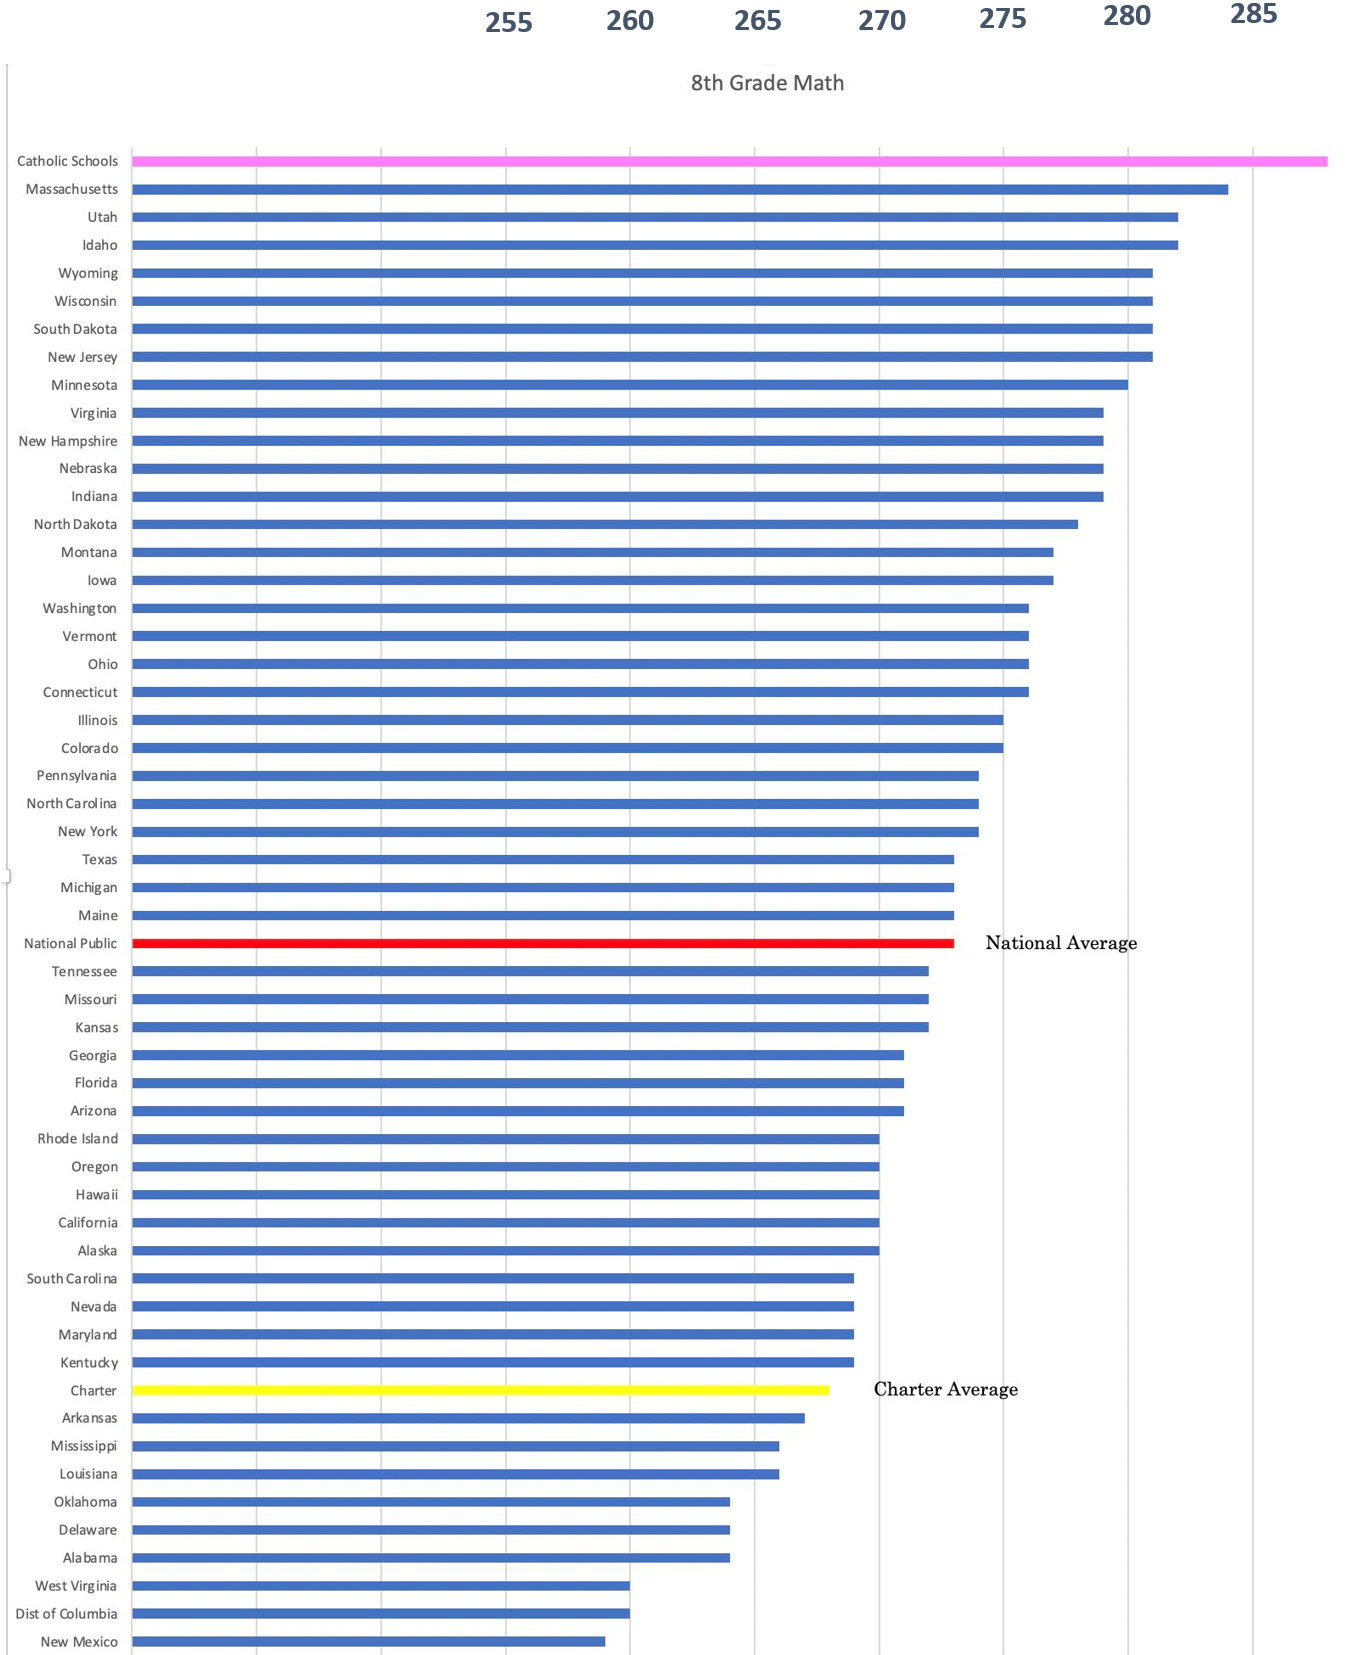
Math: Grade 8
Copyright © 2000 - 2023 CAPSO